See what is moving.
Know what to do next.

Connect the live Google Discover feed with trend lifecycle, entities, categories and publisher intelligence — then turn a market signal into a defensible content decision.

Production cabinetUS · EN · 24H
USA Explorer curve, publications and market leaders

From a moving signal to a shared decision.

Each lens answers a different question. Together they replace a wall of charts with a repeatable research path.

  1. 01

    Observe

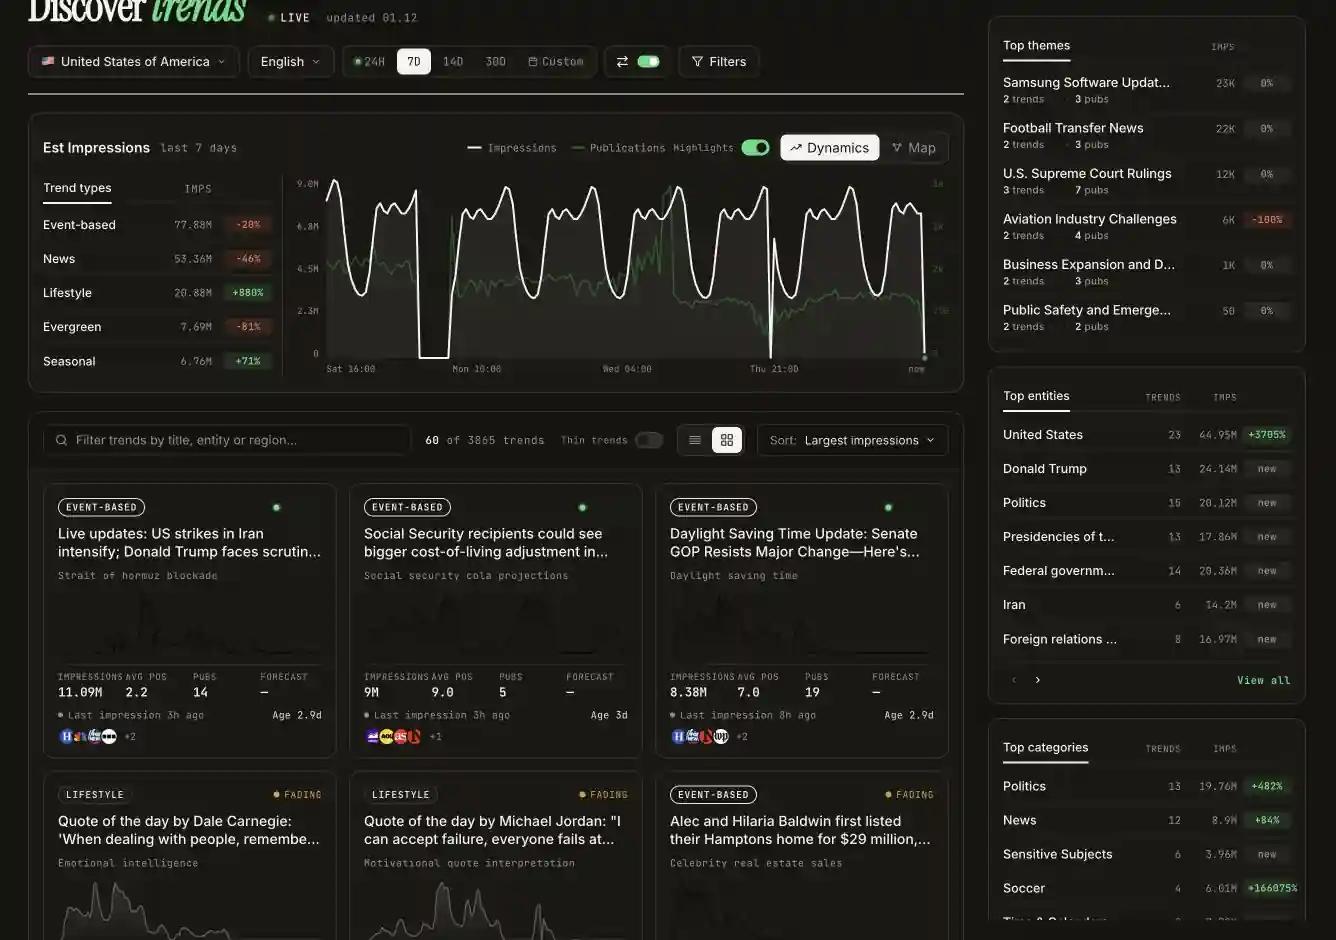
    Watch live estimated impressions, publication volume and the topics gaining or losing momentum.

  2. 02

    Explain

    Use trend type, lifespan, entities, categories and pulse to understand what is driving the move.

  3. 03

    Benchmark

    Compare publishers, authors, market share, average position and geographic demand.

  4. 04

    Act

    Export a CSV, add the signal to tracking or carry the evidence into your editorial workflow.

Keep the context. Change the question.

Keep market, language and period fixed as you move between lenses.

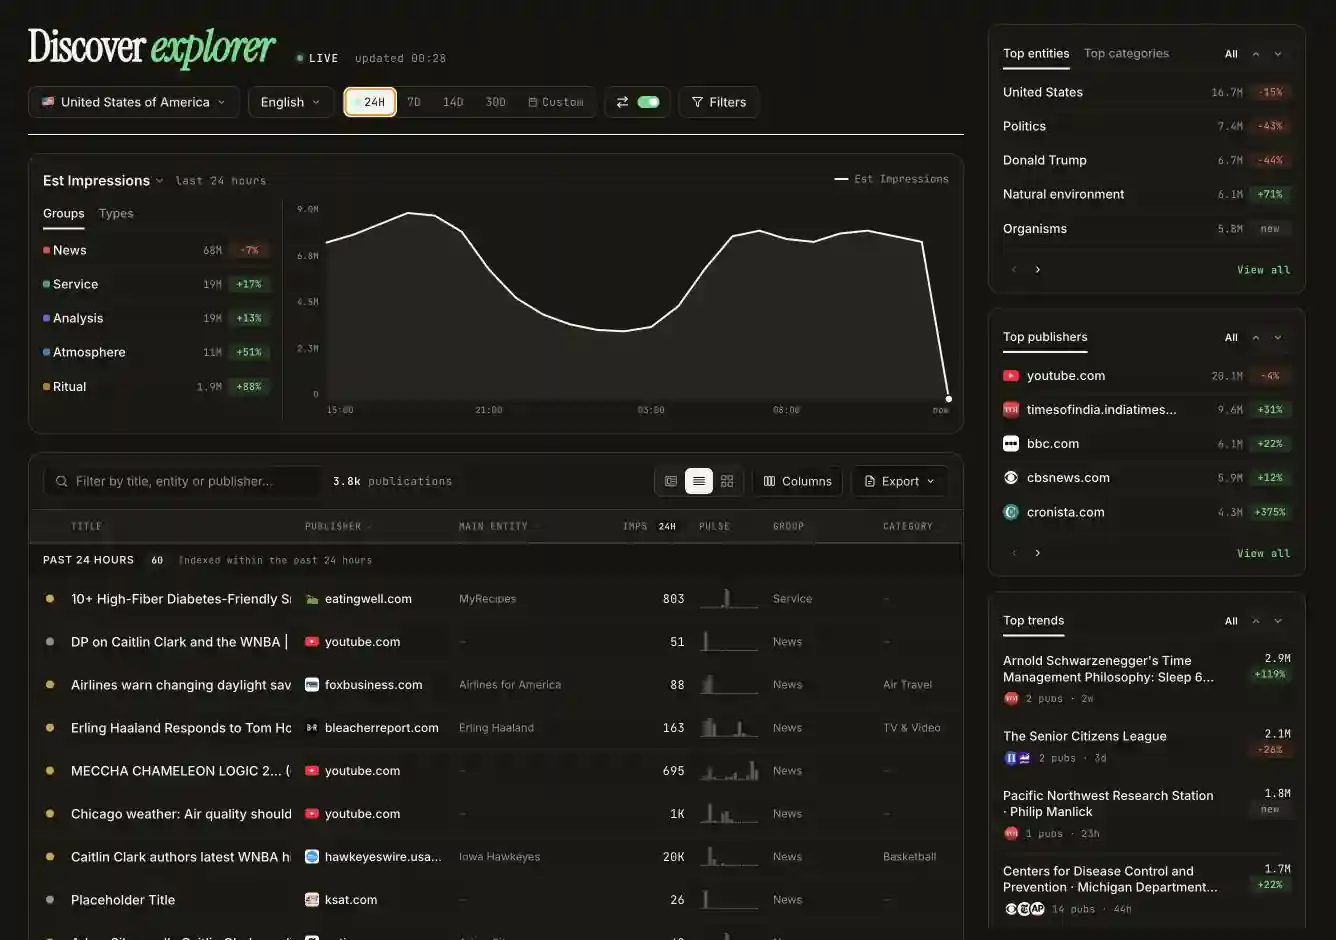
EXPLORER · THE MARKET NOW

Start broad. See the whole surface before choosing a story.

Read estimated reach and publication dynamics by format, then move from the market curve into the actual articles, entities, publishers and trends behind it.

  • Market, language and period
  • Groups and content types
  • Live publication cards
  • Top market leaders
Market overviewUS · EN · 24H
USA Explorer curve, publications and market leaders

Read the market curve, format mix and live leaders before narrowing the question.

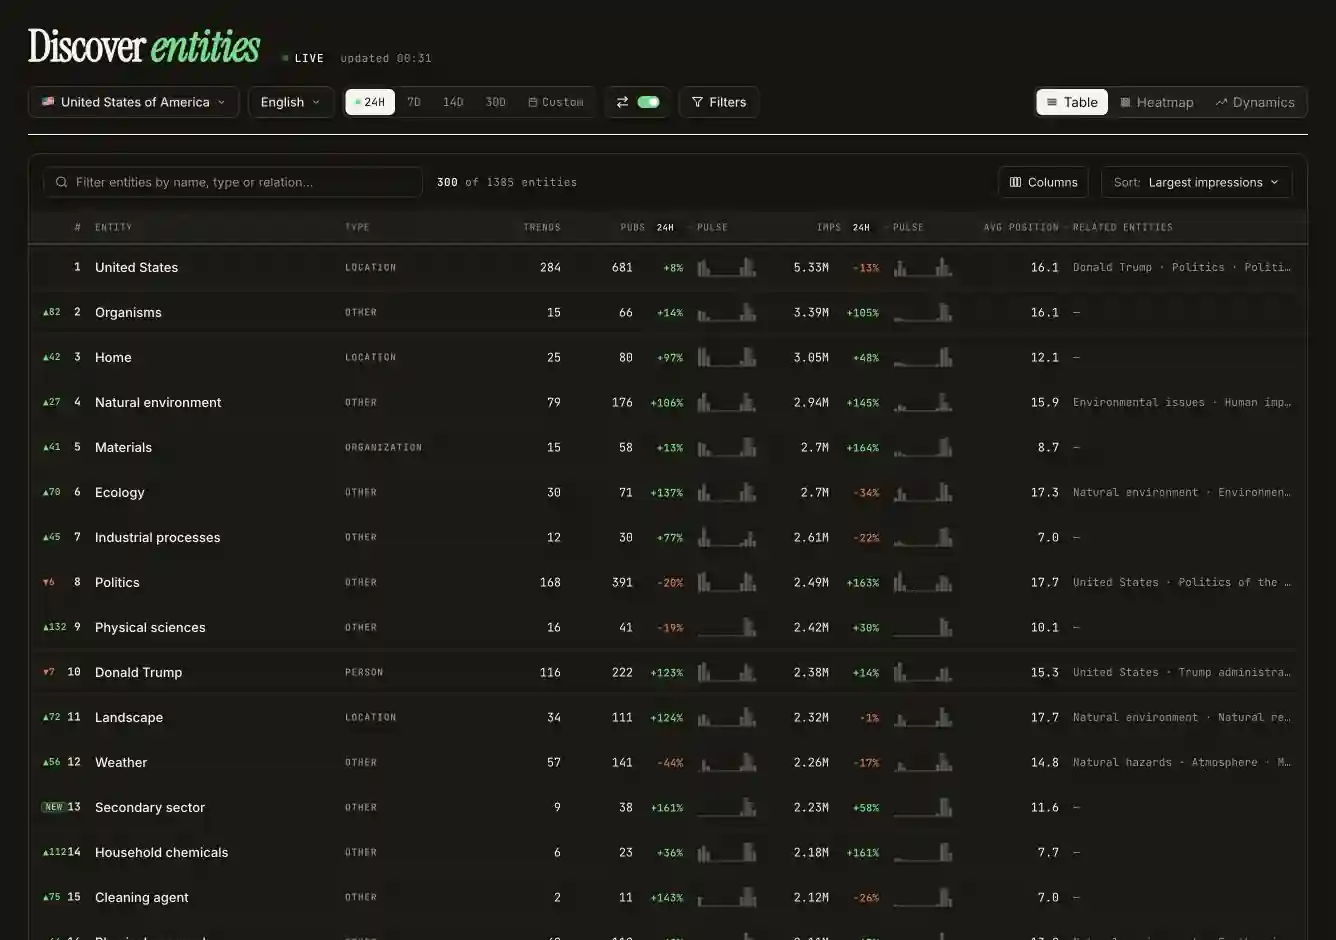
ENTITIES · THE ATTENTION GRAPH

Find the people, places and ideas pulling the market together.

Move from the leaderboard to a seven-day heatmap and rank history, then open one entity to connect its curve with publications and a network of related interests.

  • Table, heatmap and dynamics
  • Rank, type and average position
  • Active chart highlights
  • Related entity graph
Entity rankingUS · EN · 24H
USA entities ranked by visibility metrics

Rank interests by trend count, publication volume, estimated reach, pulse and average position.

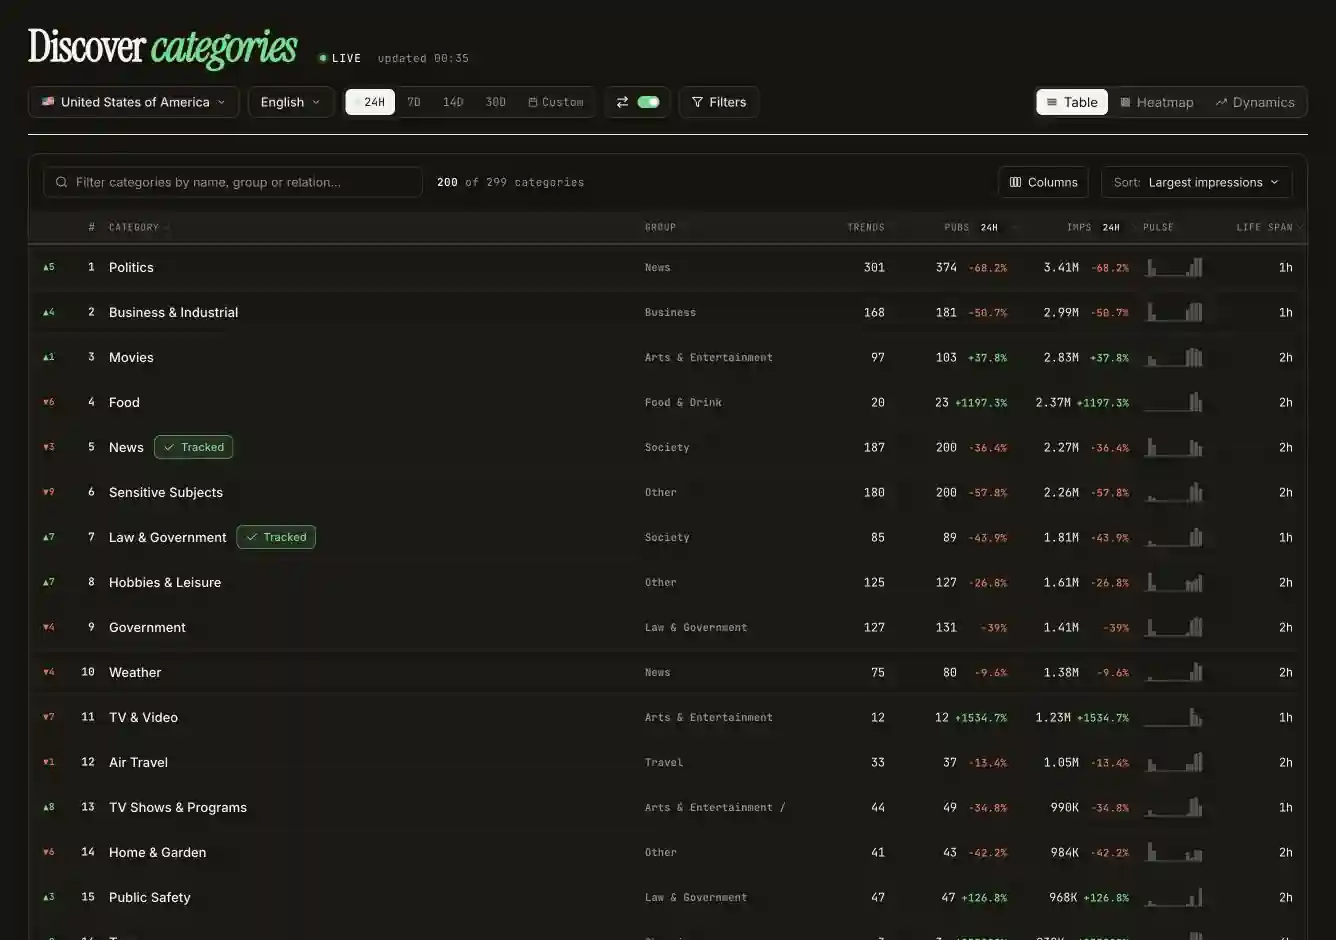
CATEGORIES · THE DEMAND MAP

Read the editorial territories expanding beneath individual stories.

Compare category reach, publication intensity and lifespan, then use weekly heatmaps and rank history to separate a durable territory from a one-day spike.

  • Taxonomy and parent group
  • Trend and publication volume
  • Seven-day category heatmap
  • Lifespan and rank movement
Category rankingUS · EN · 24H
USA categories ranked by visibility metrics

Compare category demand with trend count, publishing intensity, estimated impressions and lifespan.

PUBLISHERS · THE COMPETITIVE FIELD

See who owns the conversation — and how they are doing it.

Move from top publishers, heatmap and weekly rank history into a full domain profile: reach, publishing rhythm, average position, geography, categories and the entities behind visibility.

  • Publisher table, heatmap and dynamics
  • Market share and period comparison
  • Domain content and entity mix
  • Geography and competitor context
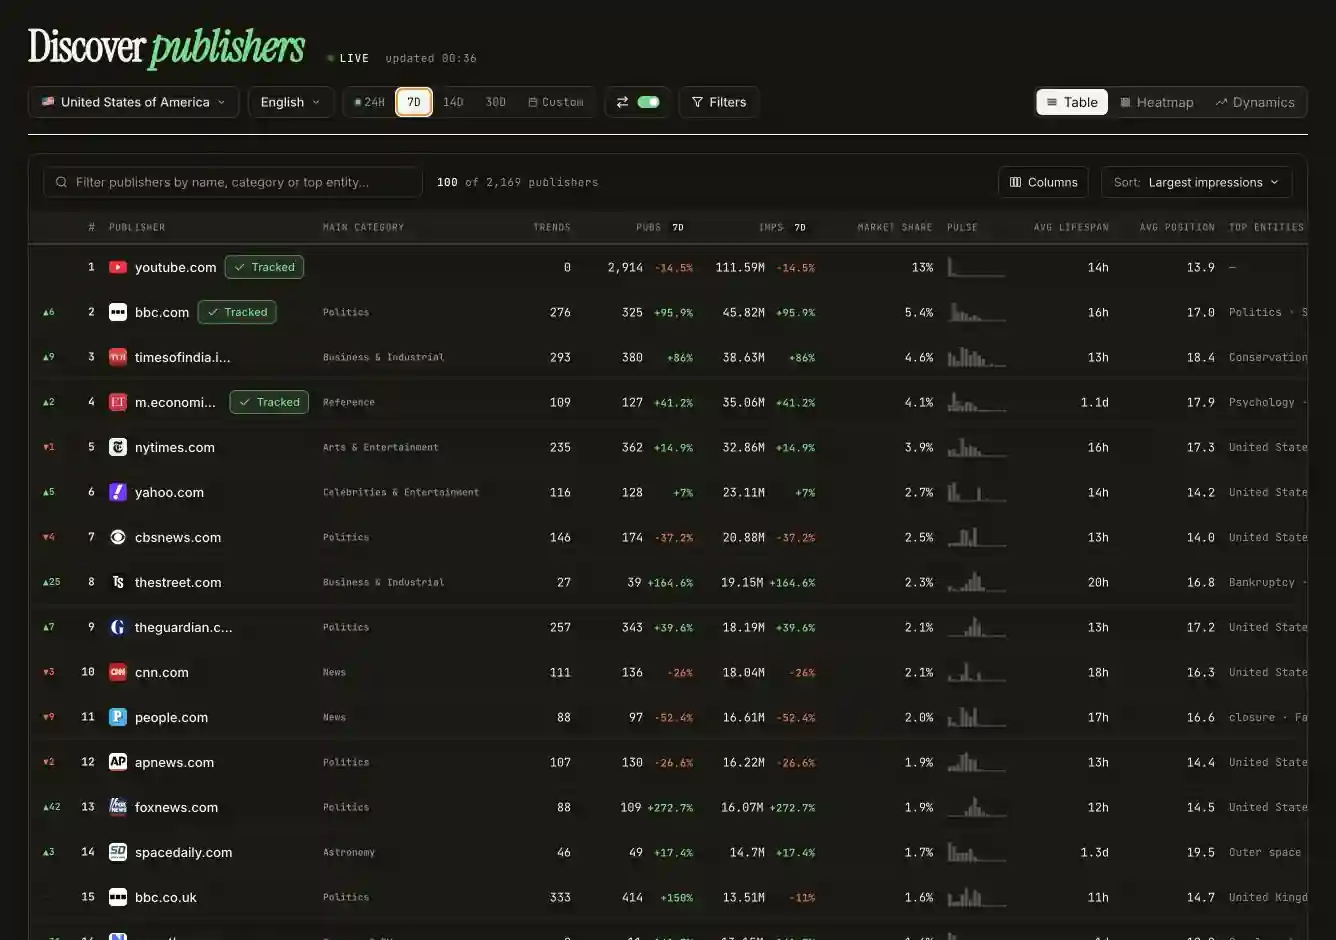
Top publishersUS · EN · 7D
Seven-day USA publisher rankings and market share

Benchmark domains by market share, estimated reach, publishing volume, lifespan and average position.

Built around the decision your team owns.

The product stays consistent; the signal path changes. Pick a role to see the most useful route through the cabinet.

NEWSROOM · EDITORIAL DESK

Commission the right story while the window is still open.

Start with the live feed, qualify the story by trend type and lifespan, then see which publishers and authors already own the conversation.

Signals to use

  • Rising estimated impressions and publication pulse
  • Event-based, news, evergreen, lifestyle or seasonal intent
  • Competitor coverage, average position and geographic demand
DecisionPrioritize the assignment, angle and publishing window with shared market evidence.

Metrics with a job, not vanity totals.

Use each measure comparatively inside the selected market, language, filters and period. The strongest decision combines several signals.

Estimated impressions
A directional estimate of visibility on Google Discover, useful for comparing movement within the same view and time window.
Pulse
The shape of publication or impression activity over time — acceleration is visible before a total tells the whole story.
Lifespan
How long a trend, category or publisher signal stays active in the selected market and period.
Average position
The mean observed position in the Discover feed. Lower is better; use it with reach and publication volume, not alone.
Market share
A publisher’s portion of estimated visibility in the selected slice — a competitive benchmark, not a traffic audit.
Comparison
Current versus previous period, so every increase or decline has a consistent baseline for the same filters.
METHOD NOTE

Estimated impressions describe observed Discover visibility; they are directional product estimates, not first-party publisher traffic or Google Search Console data. Read the methodology.

Pricing
and plans.

START
$298/mo
Billed annually

For a single market and a focused editorial sprint.

  • Markets1 country
  • Categories tracked5
  • Entities tracked20
  • Mentions tracked20
  • Live data access
  • Historical data14 days
  • Trend tracking
  • Users1
  • Websites1
  • Article optimizations20
Signup
★ MOST PICKED
PRODUCER
$1,498/mo
Billed annually

For newsrooms and content teams covering multiple markets and brands.

  • Markets30 countries
  • Categories tracked
  • Entities tracked
  • Mentions tracked500
  • Live data access
  • Historical dataFull history
  • Trend tracking
  • Users10
  • Websites10
  • Article optimizations300
Signup
ENTERPRISE
Custom

For media groups with bespoke data needs and custom SLAs.

  • MarketsCUSTOM
  • Categories tracked
  • Entities tracked
  • Mentions trackedCUSTOM
  • Live data access
  • Historical dataFull history
  • Trend tracking
  • UsersCUSTOM
  • WebsitesCUSTOM
  • Article optimizationsCUSTOM
Talk to sales
API connection add-on
Dedicated whitelisted endpoint with custom authentication and priority rate limits.
+$500/mo
on top of base plan
Request connection →

Start working with Google Discover on data, not intuition